Physics · Simple Harmonic Motion
JEE Main 2026 — 22 January, Evening Shift — Question 27
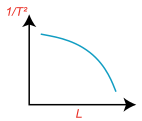
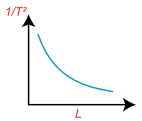
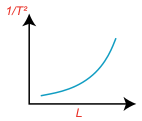
Using a simple pendulum experiment g is determined by measuring its time period T. Which of the following plots represent the correct relation between the pendulum length L and time period T?
- Option A:
- Option B:Correct
- Option C:
- Option D:
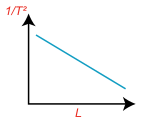
Answer: B
Step-by-step solution
Answer key and solution verified before publishing.
Practise Simple Harmonic Motion
Start with this question, then two more from the same chapter — with a tutor that explains every step. Free.
- Exam
- JEE Main 2026
- Subject
- Physics
- Chapter
- Simple Harmonic Motion
- Topic
- Simple Pendulum and Angular SHM